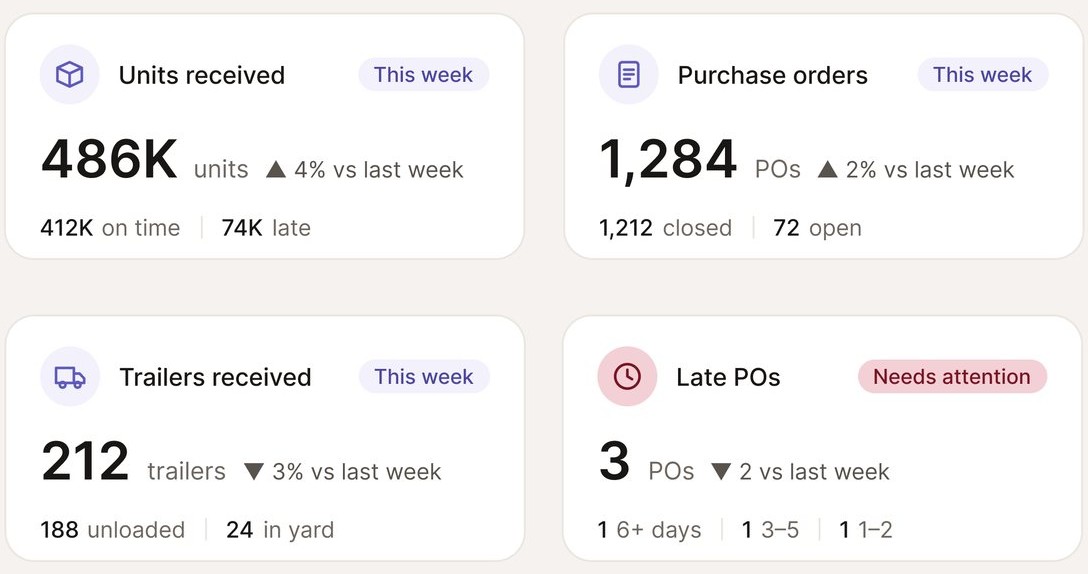
One answer per card
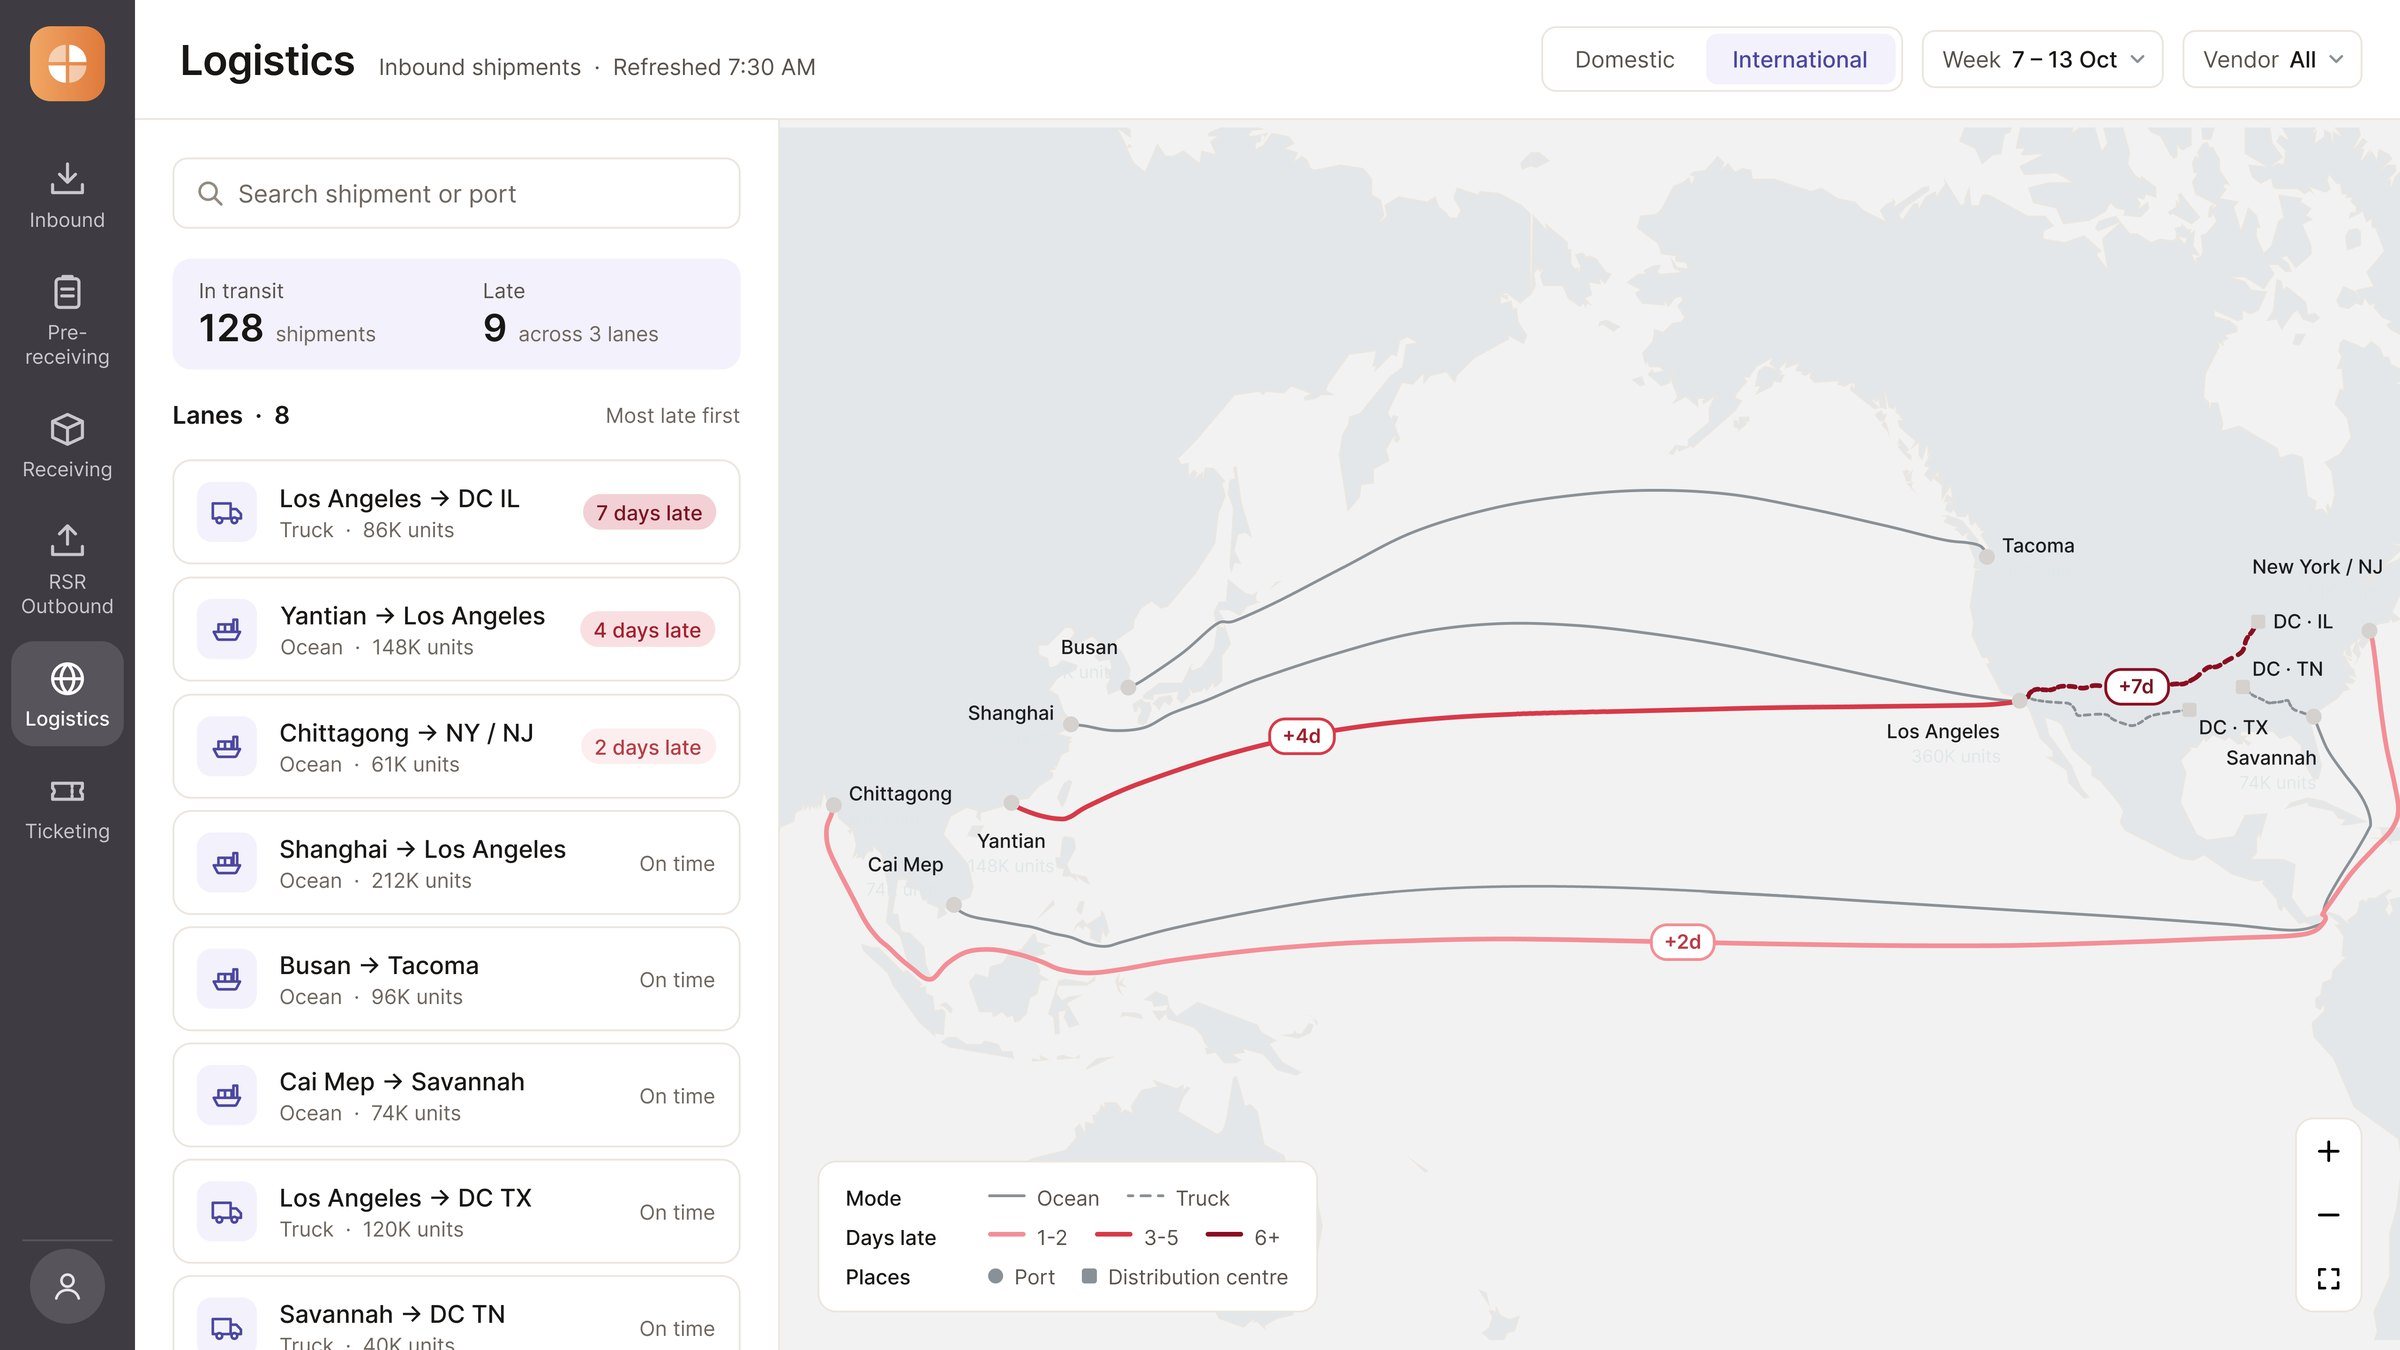
Every card leads with a single number and its trend, with the detail sitting quietly underneath.
NDA · Client unnamed · Screens re-rendered · Decisions, constraints and outcomes unchanged
For a global retailer, every product on a shelf starts as a shipment somewhere on its way, and keeping track of them all is the work of its logistics team. Until this project, that picture lived in scattered spreadsheets. It was the client’s first attempt to bring it into one place, and with everyone wanting something different on screen, the risk was a dashboard that showed everything and said nothing. Over 10 months, I led the UX strategy to turn it into one suite of dashboards: a calm, focused tool that puts what needs attention first. Today the team spots delays faster, and the dashboards proved their value as soon as they went live, earning a contract renewal from the client.
Leading the UX strategy meant shaping the decisions behind the screens as much as the screens themselves: what to show, in what order, and why.
Every requirement reached me secondhand, and every review brought new ones. The data was never the problem; deciding what to do with it was. Three problems shaped the work.
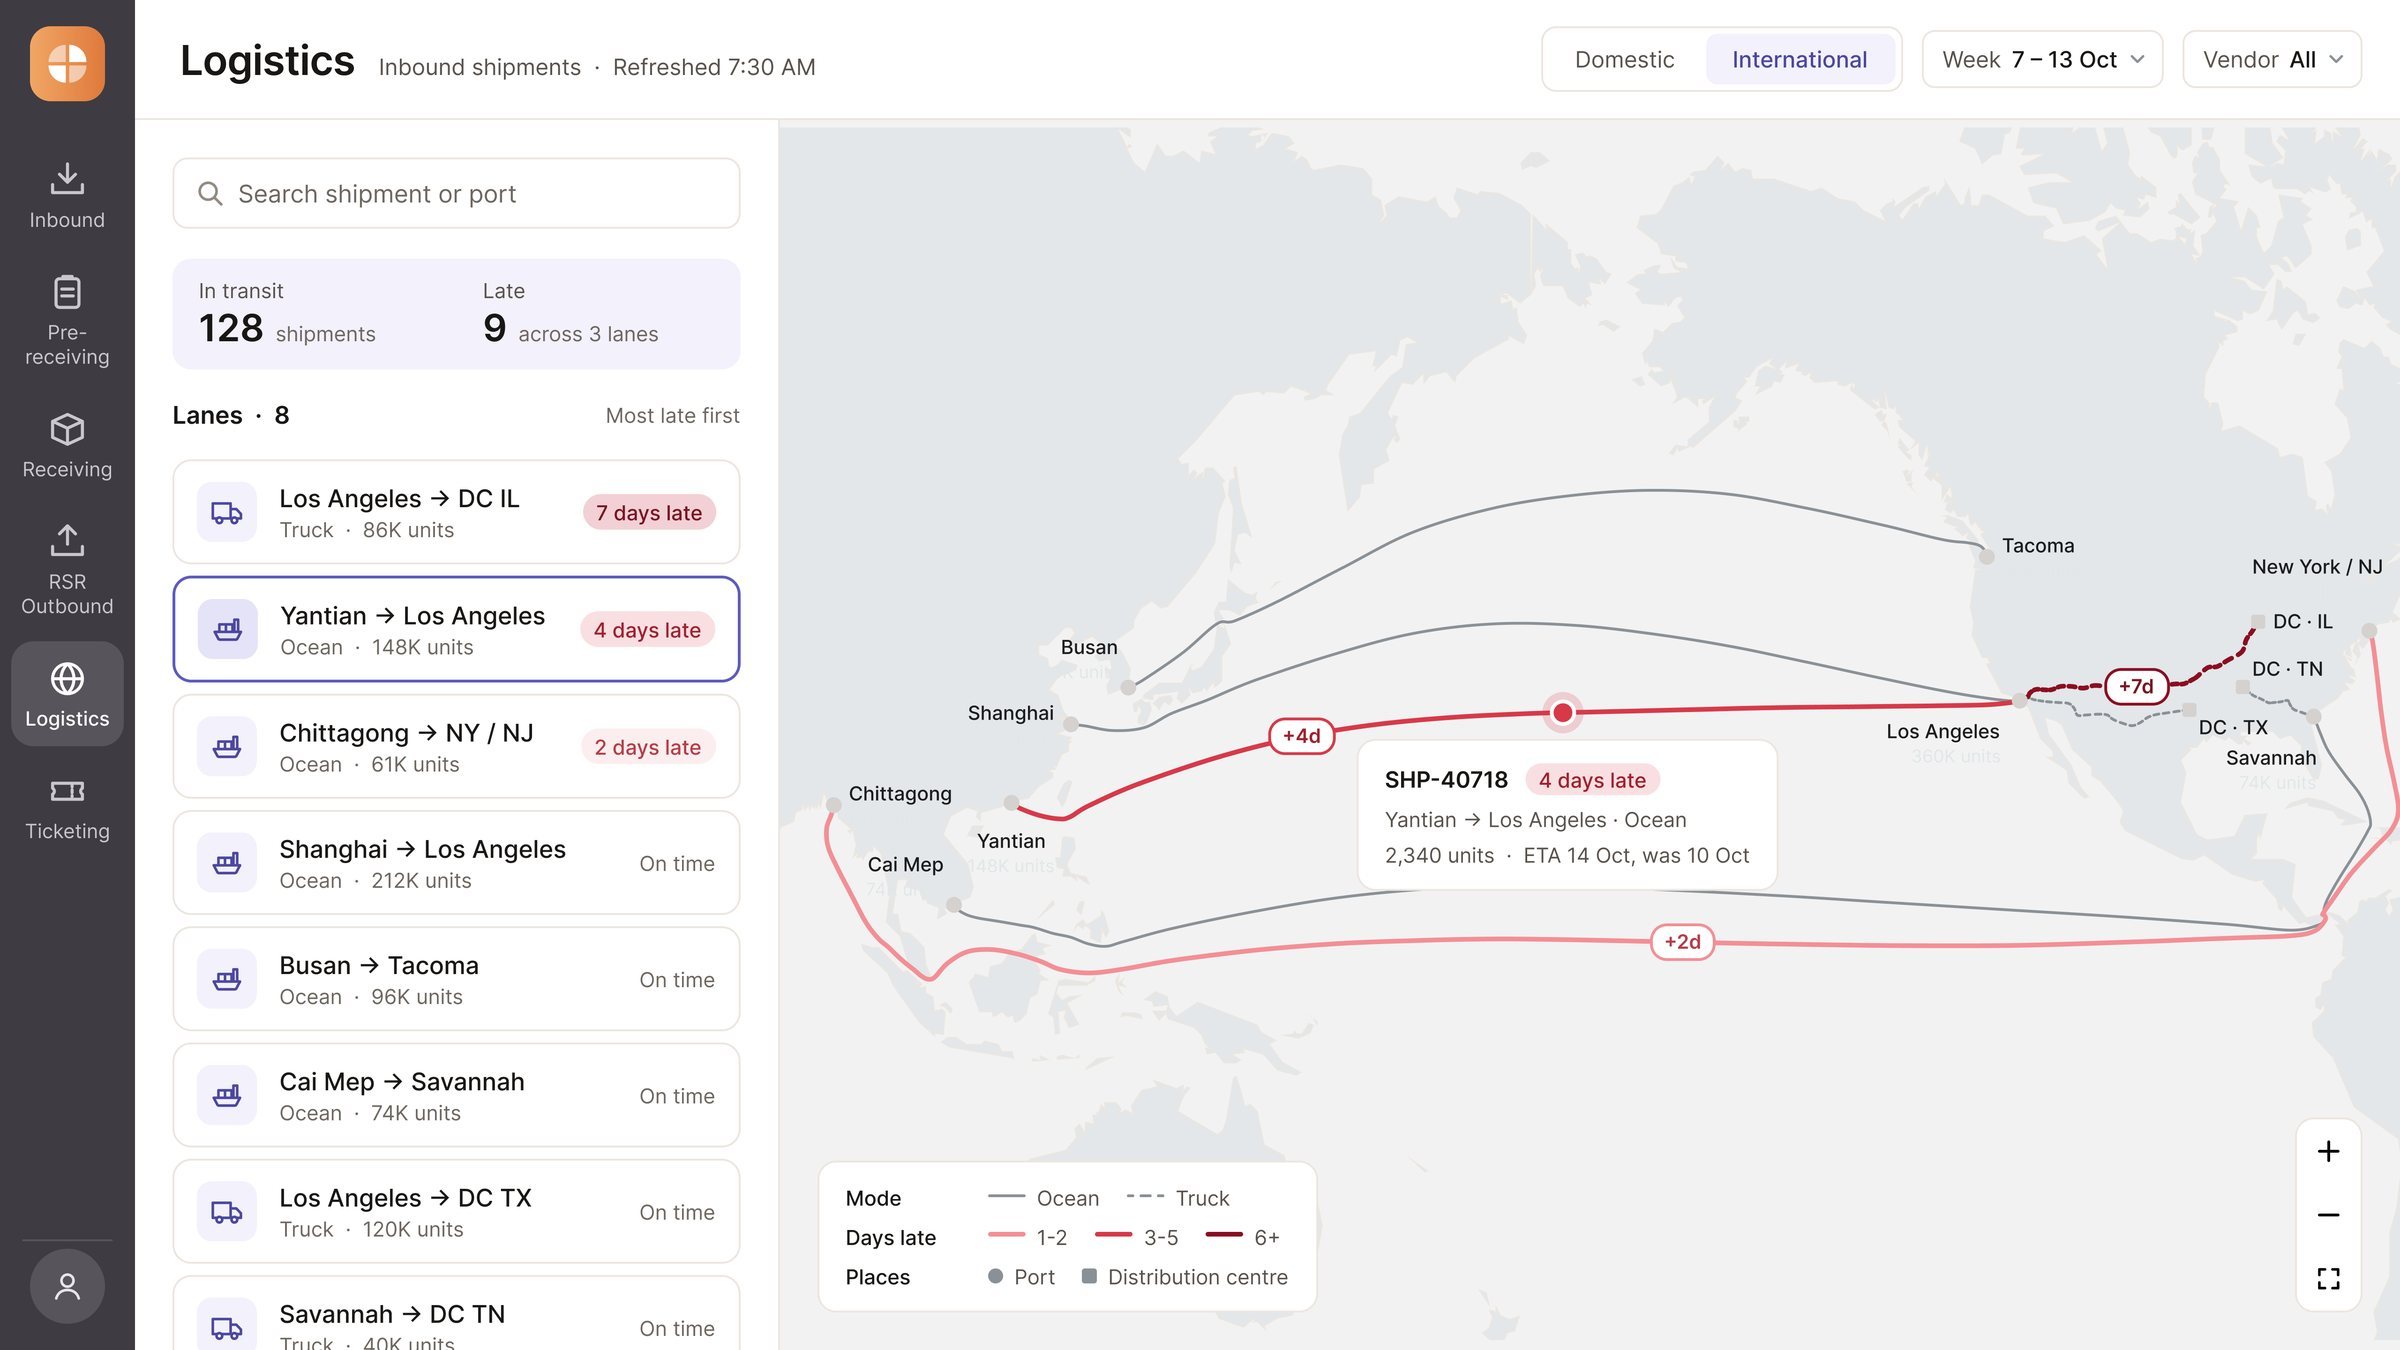
Instead of showing everything at once, we designed each dashboard to answer the most important question first, and to keep everything else within easy reach.
Every card leads with a single number and its trend, with the detail sitting quietly underneath.
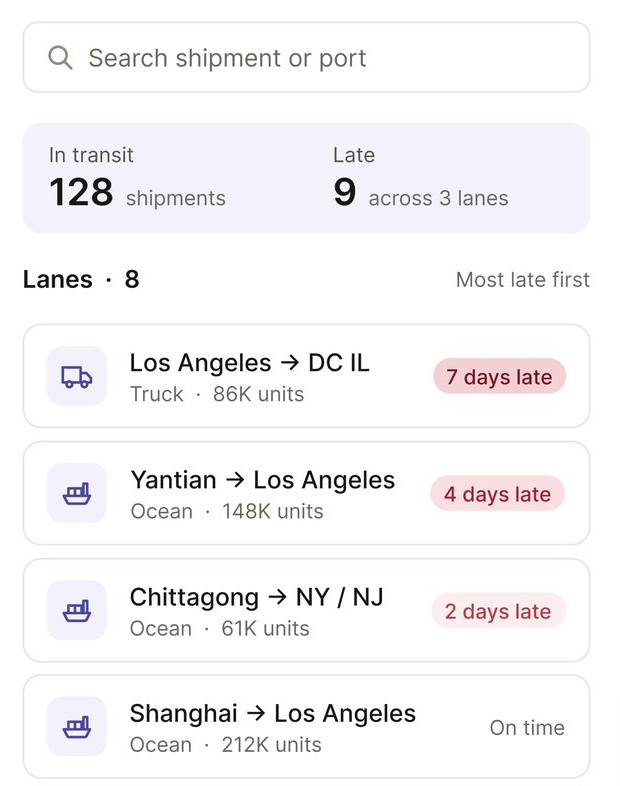
Lanes are sorted so the shipments running behind are the first thing you see.
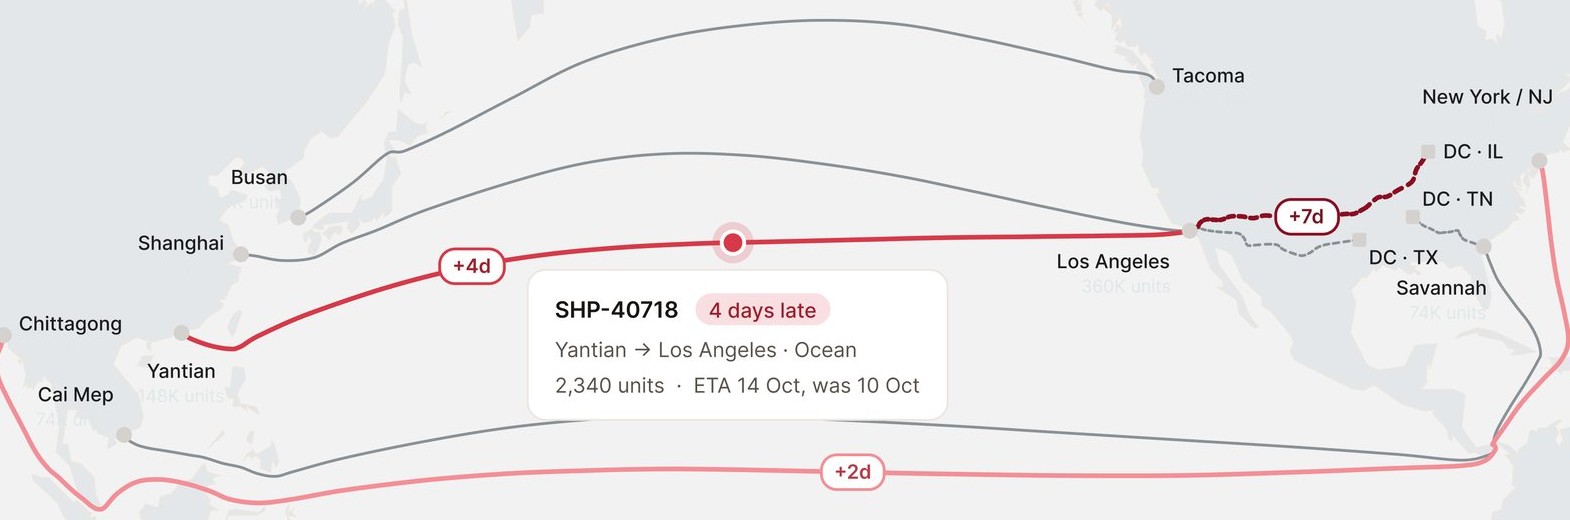
Routes stay grey until something slips, then turn red, deeper the later it runs.
Volume, productivity and financial on every dashboard.
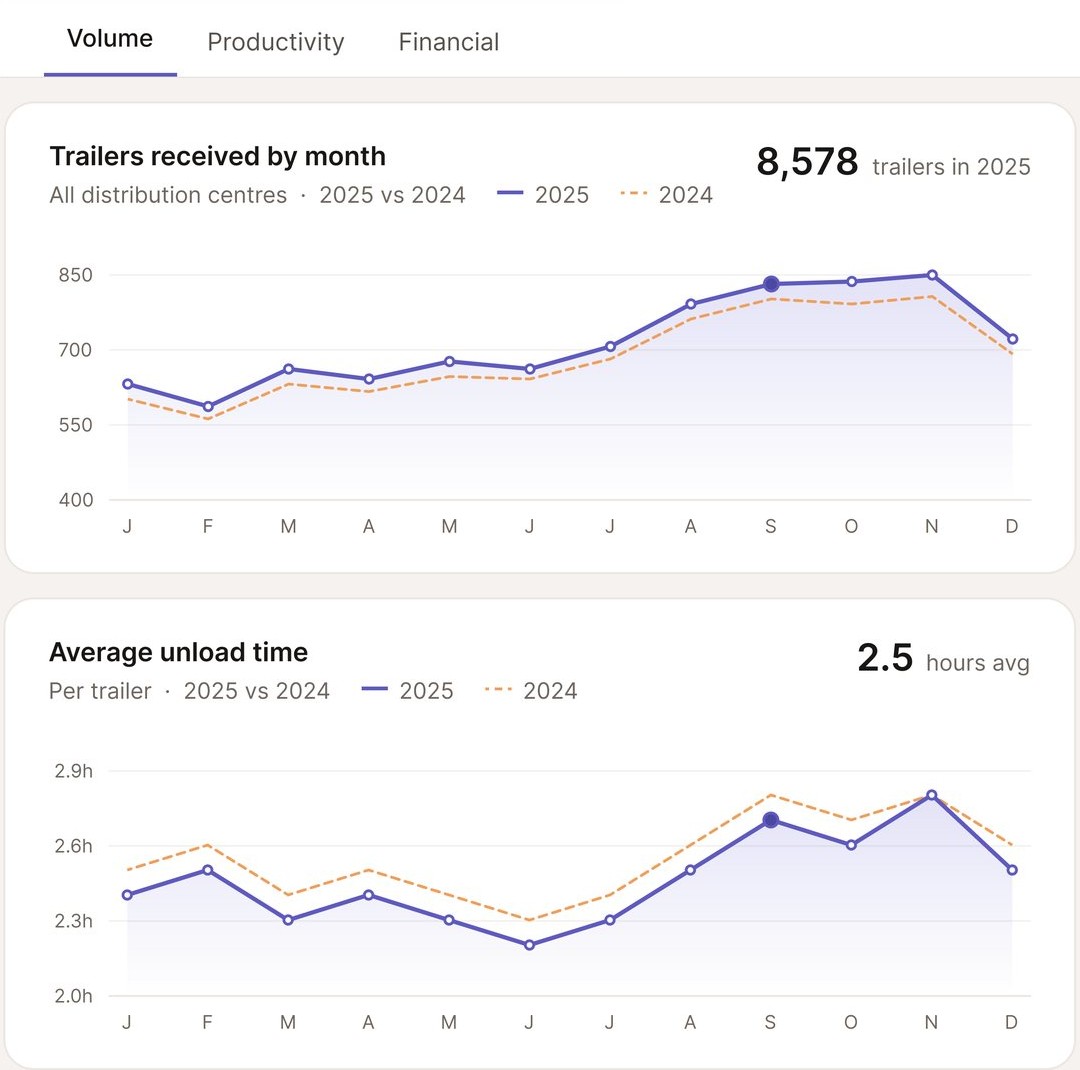
Each card answers one question at a glance: a primary number and its trend come first, and the breakdown sits below in smaller type. Nothing was deleted, it just found its place.
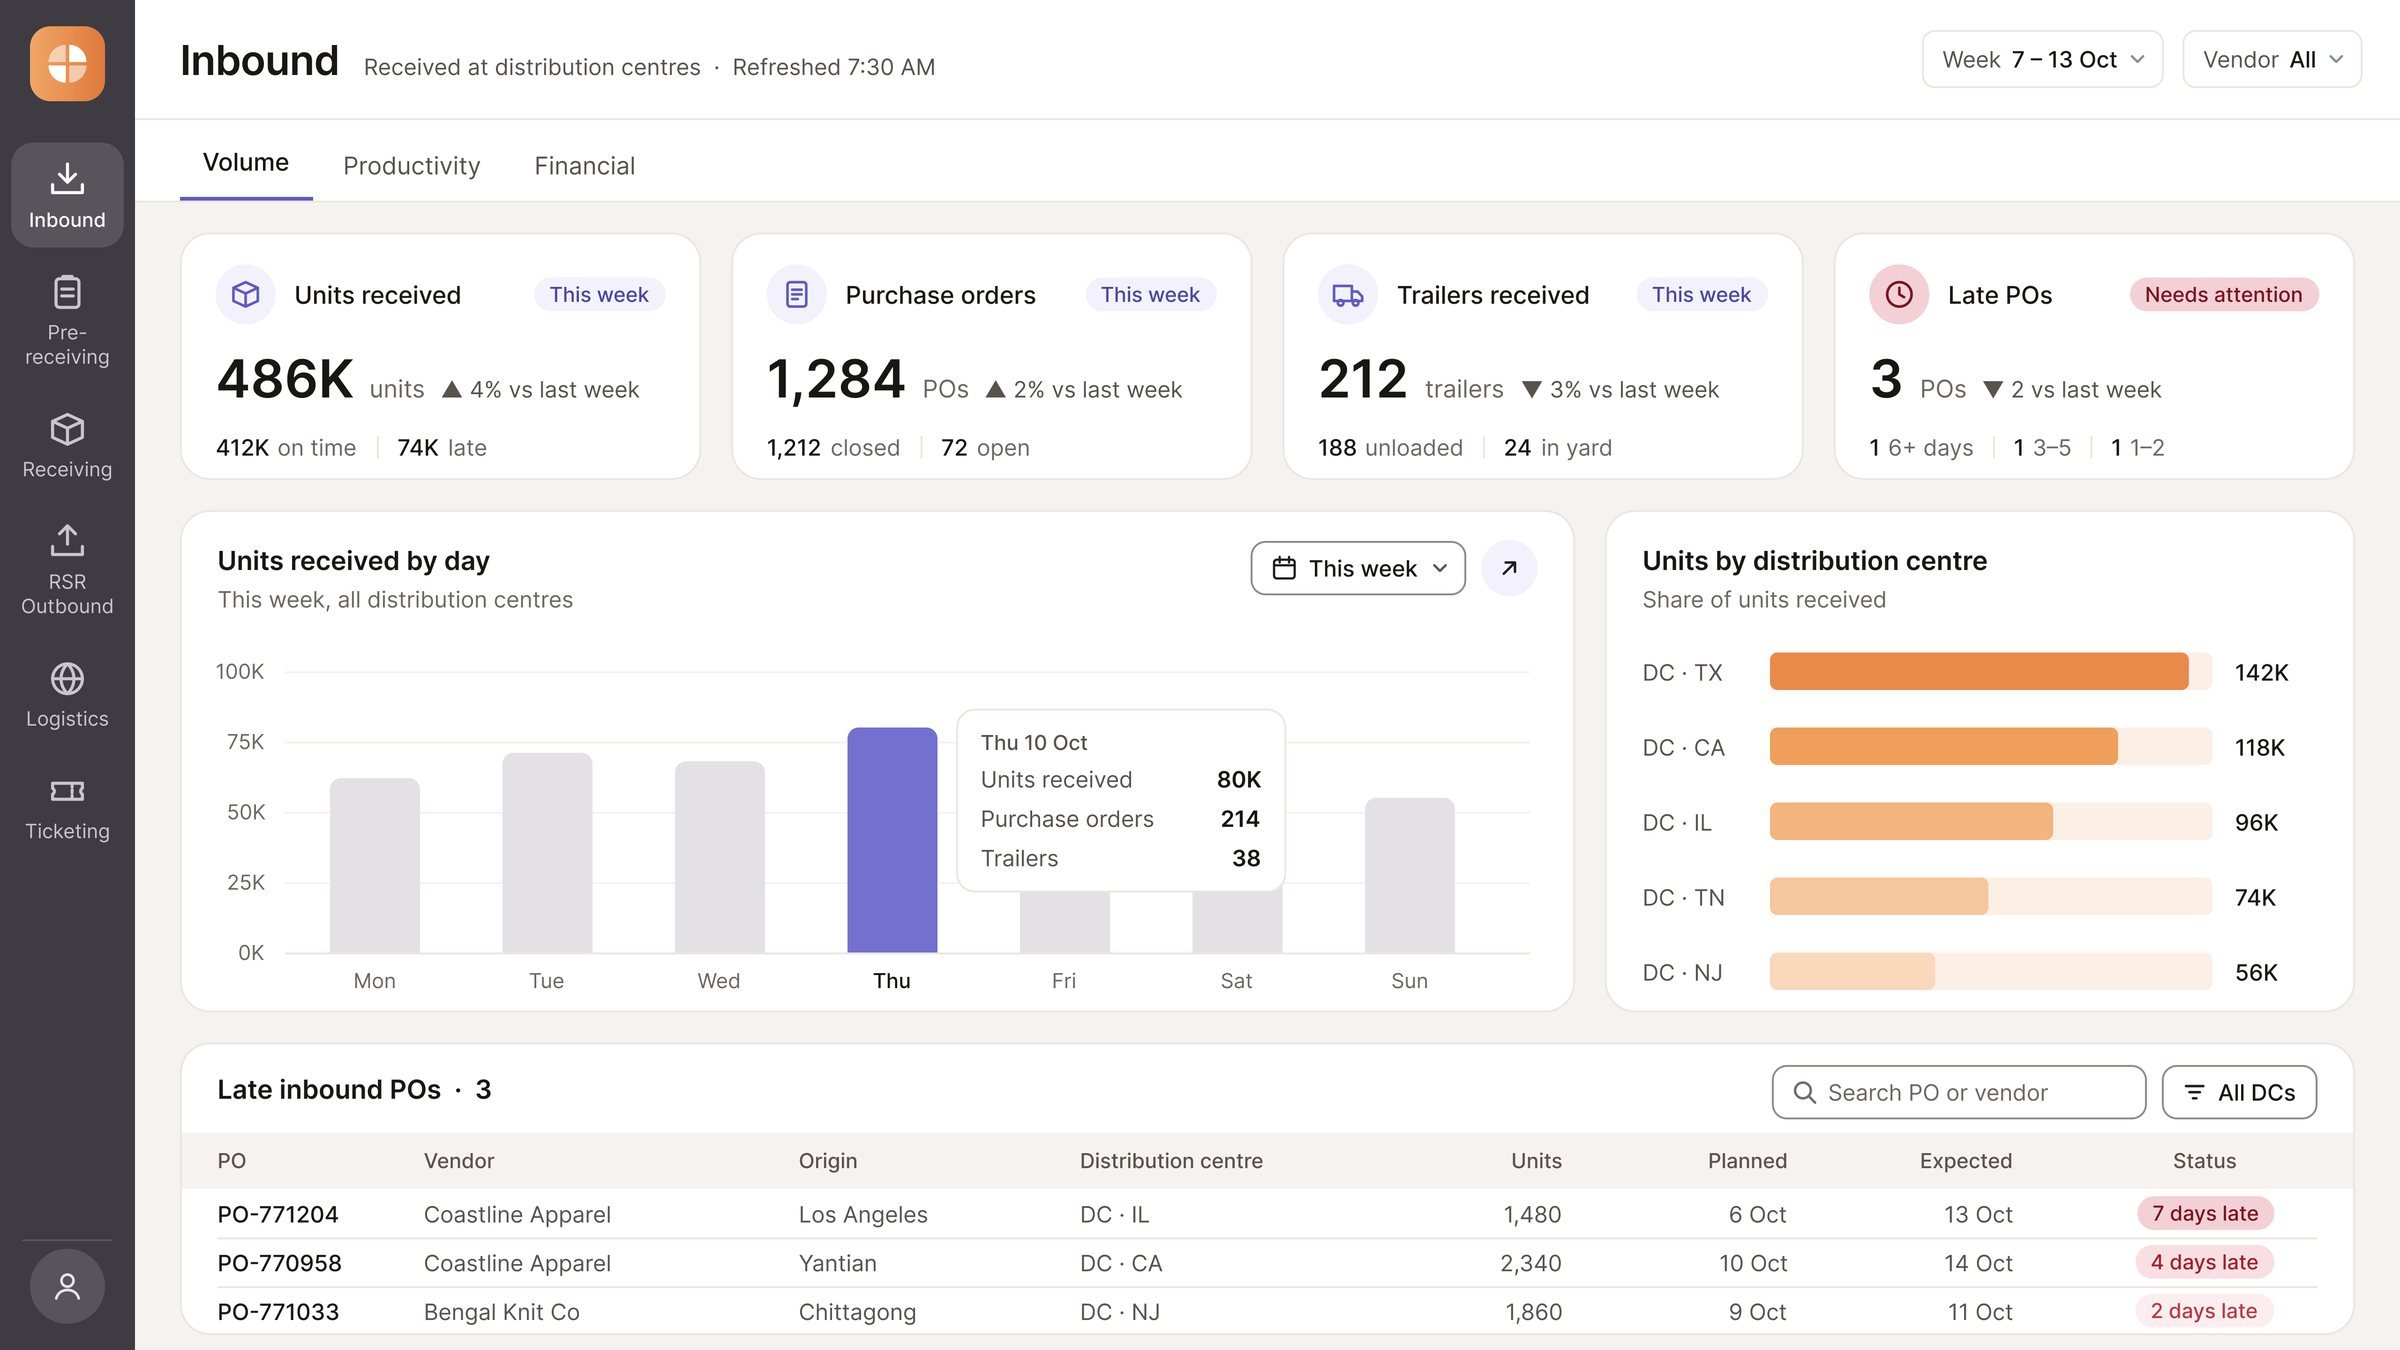
Colour follows urgency. Red is kept for shipment delays, graded by how late they are, lavender carries the core measurements, and orange handles comparisons.
Every dashboard is organised into the same three views: volume, productivity and financial. The detail is always there, just one click away, so the main view stays focused.
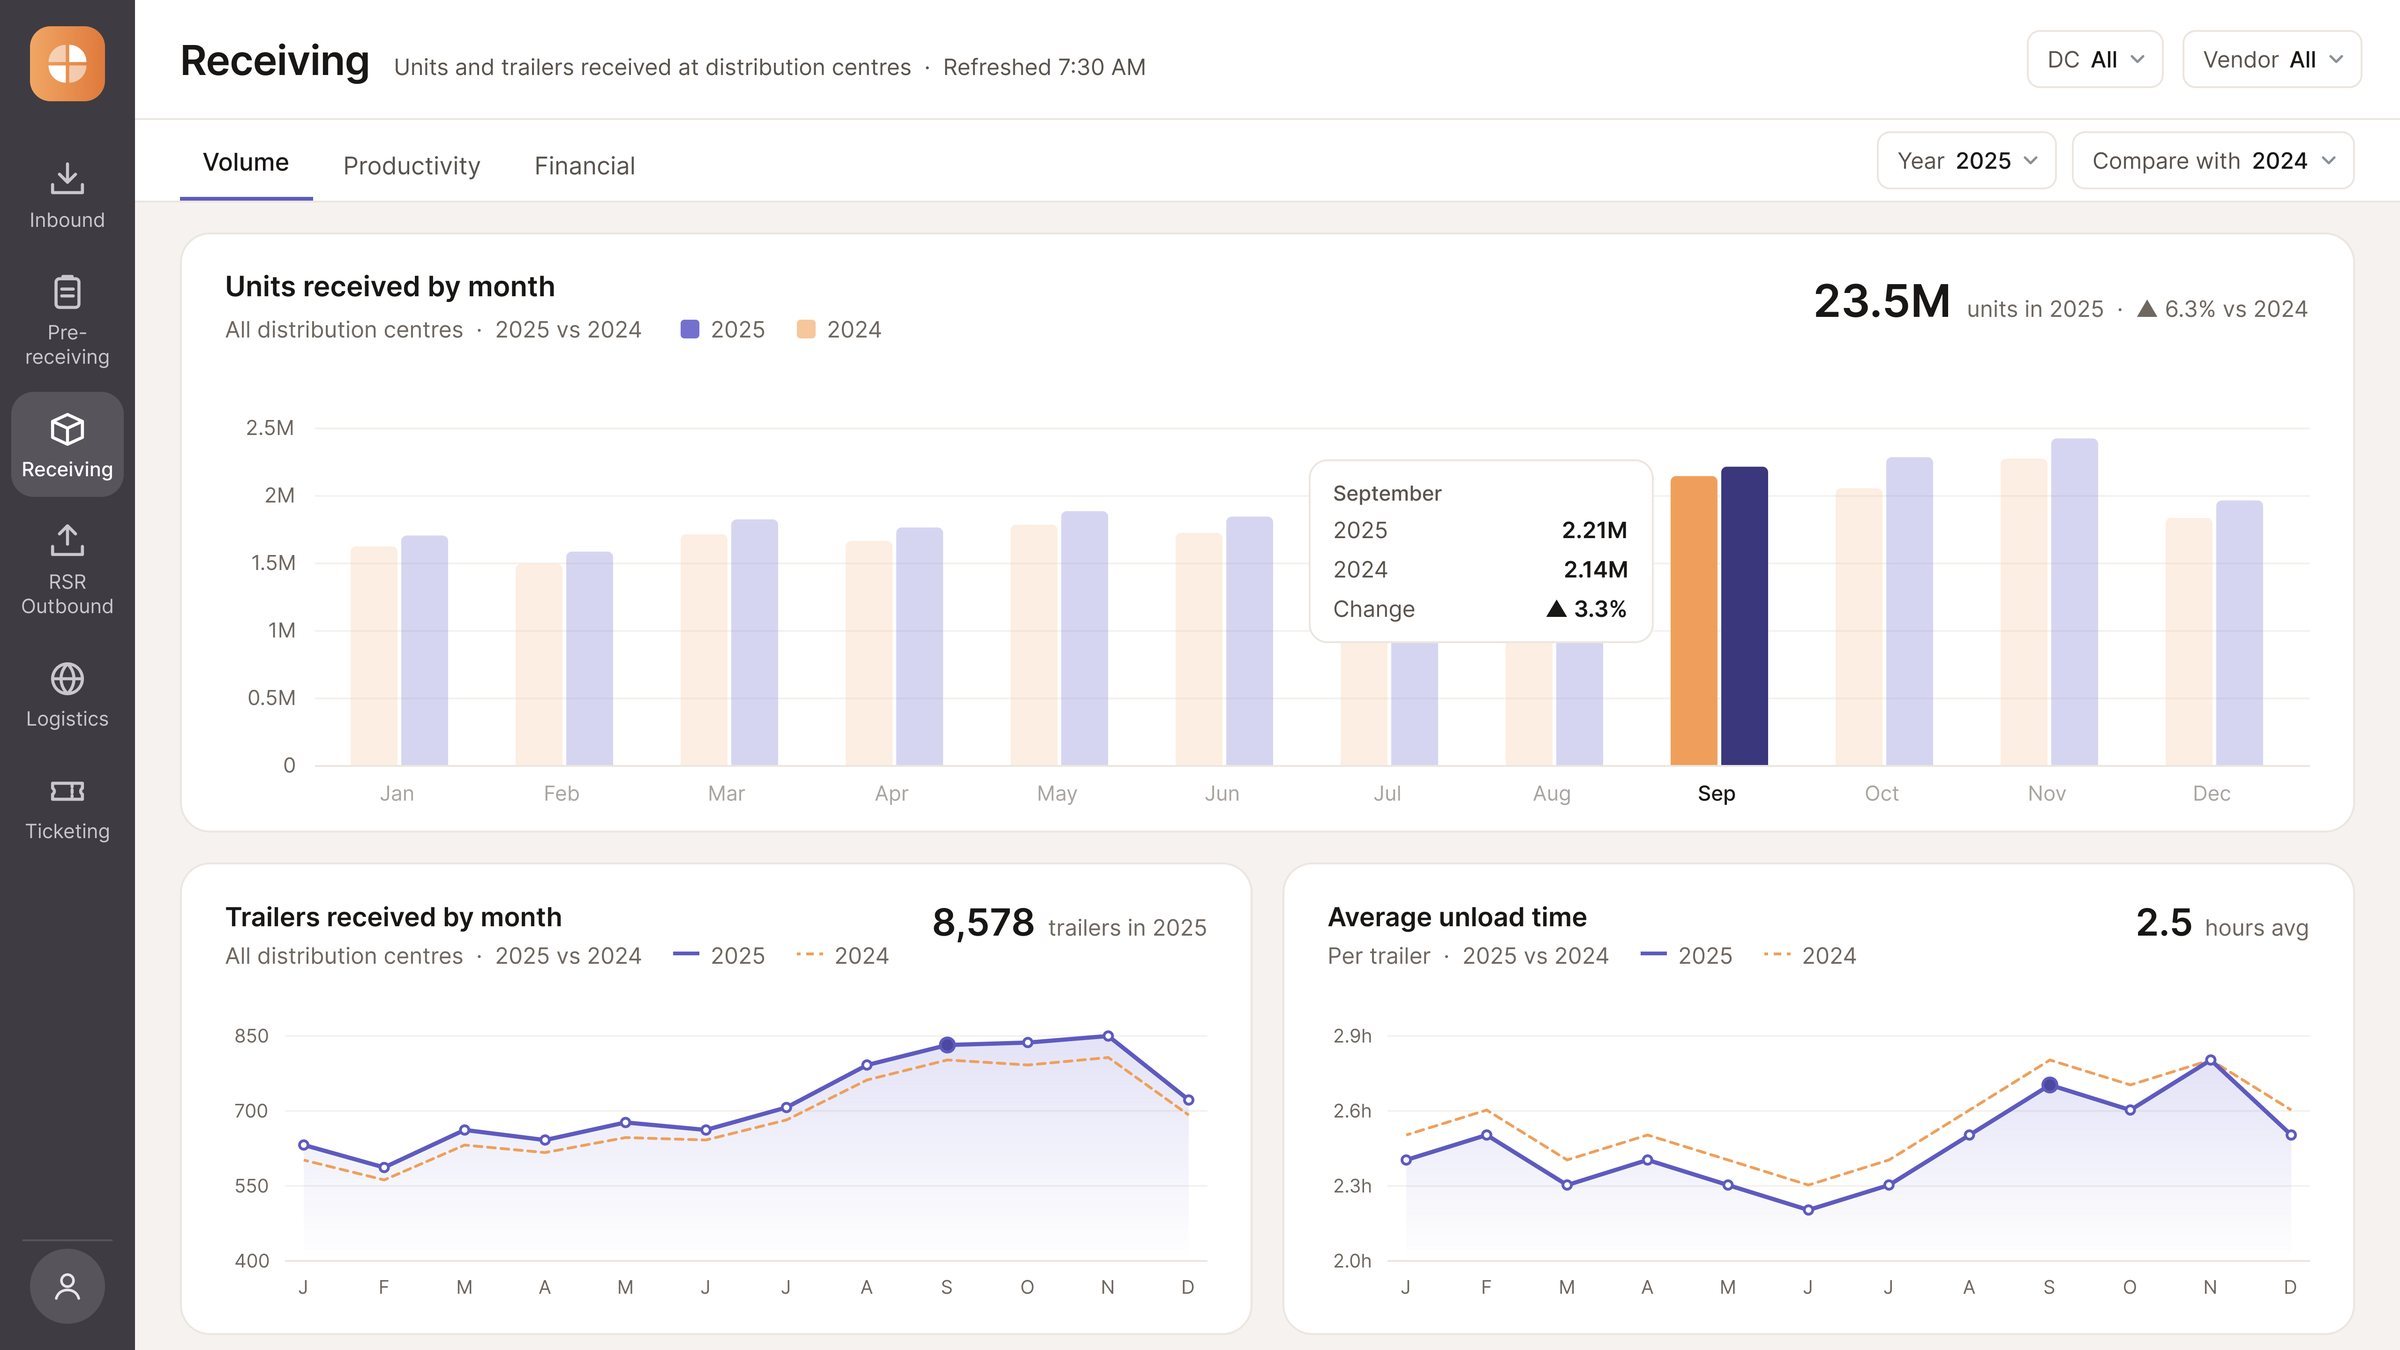
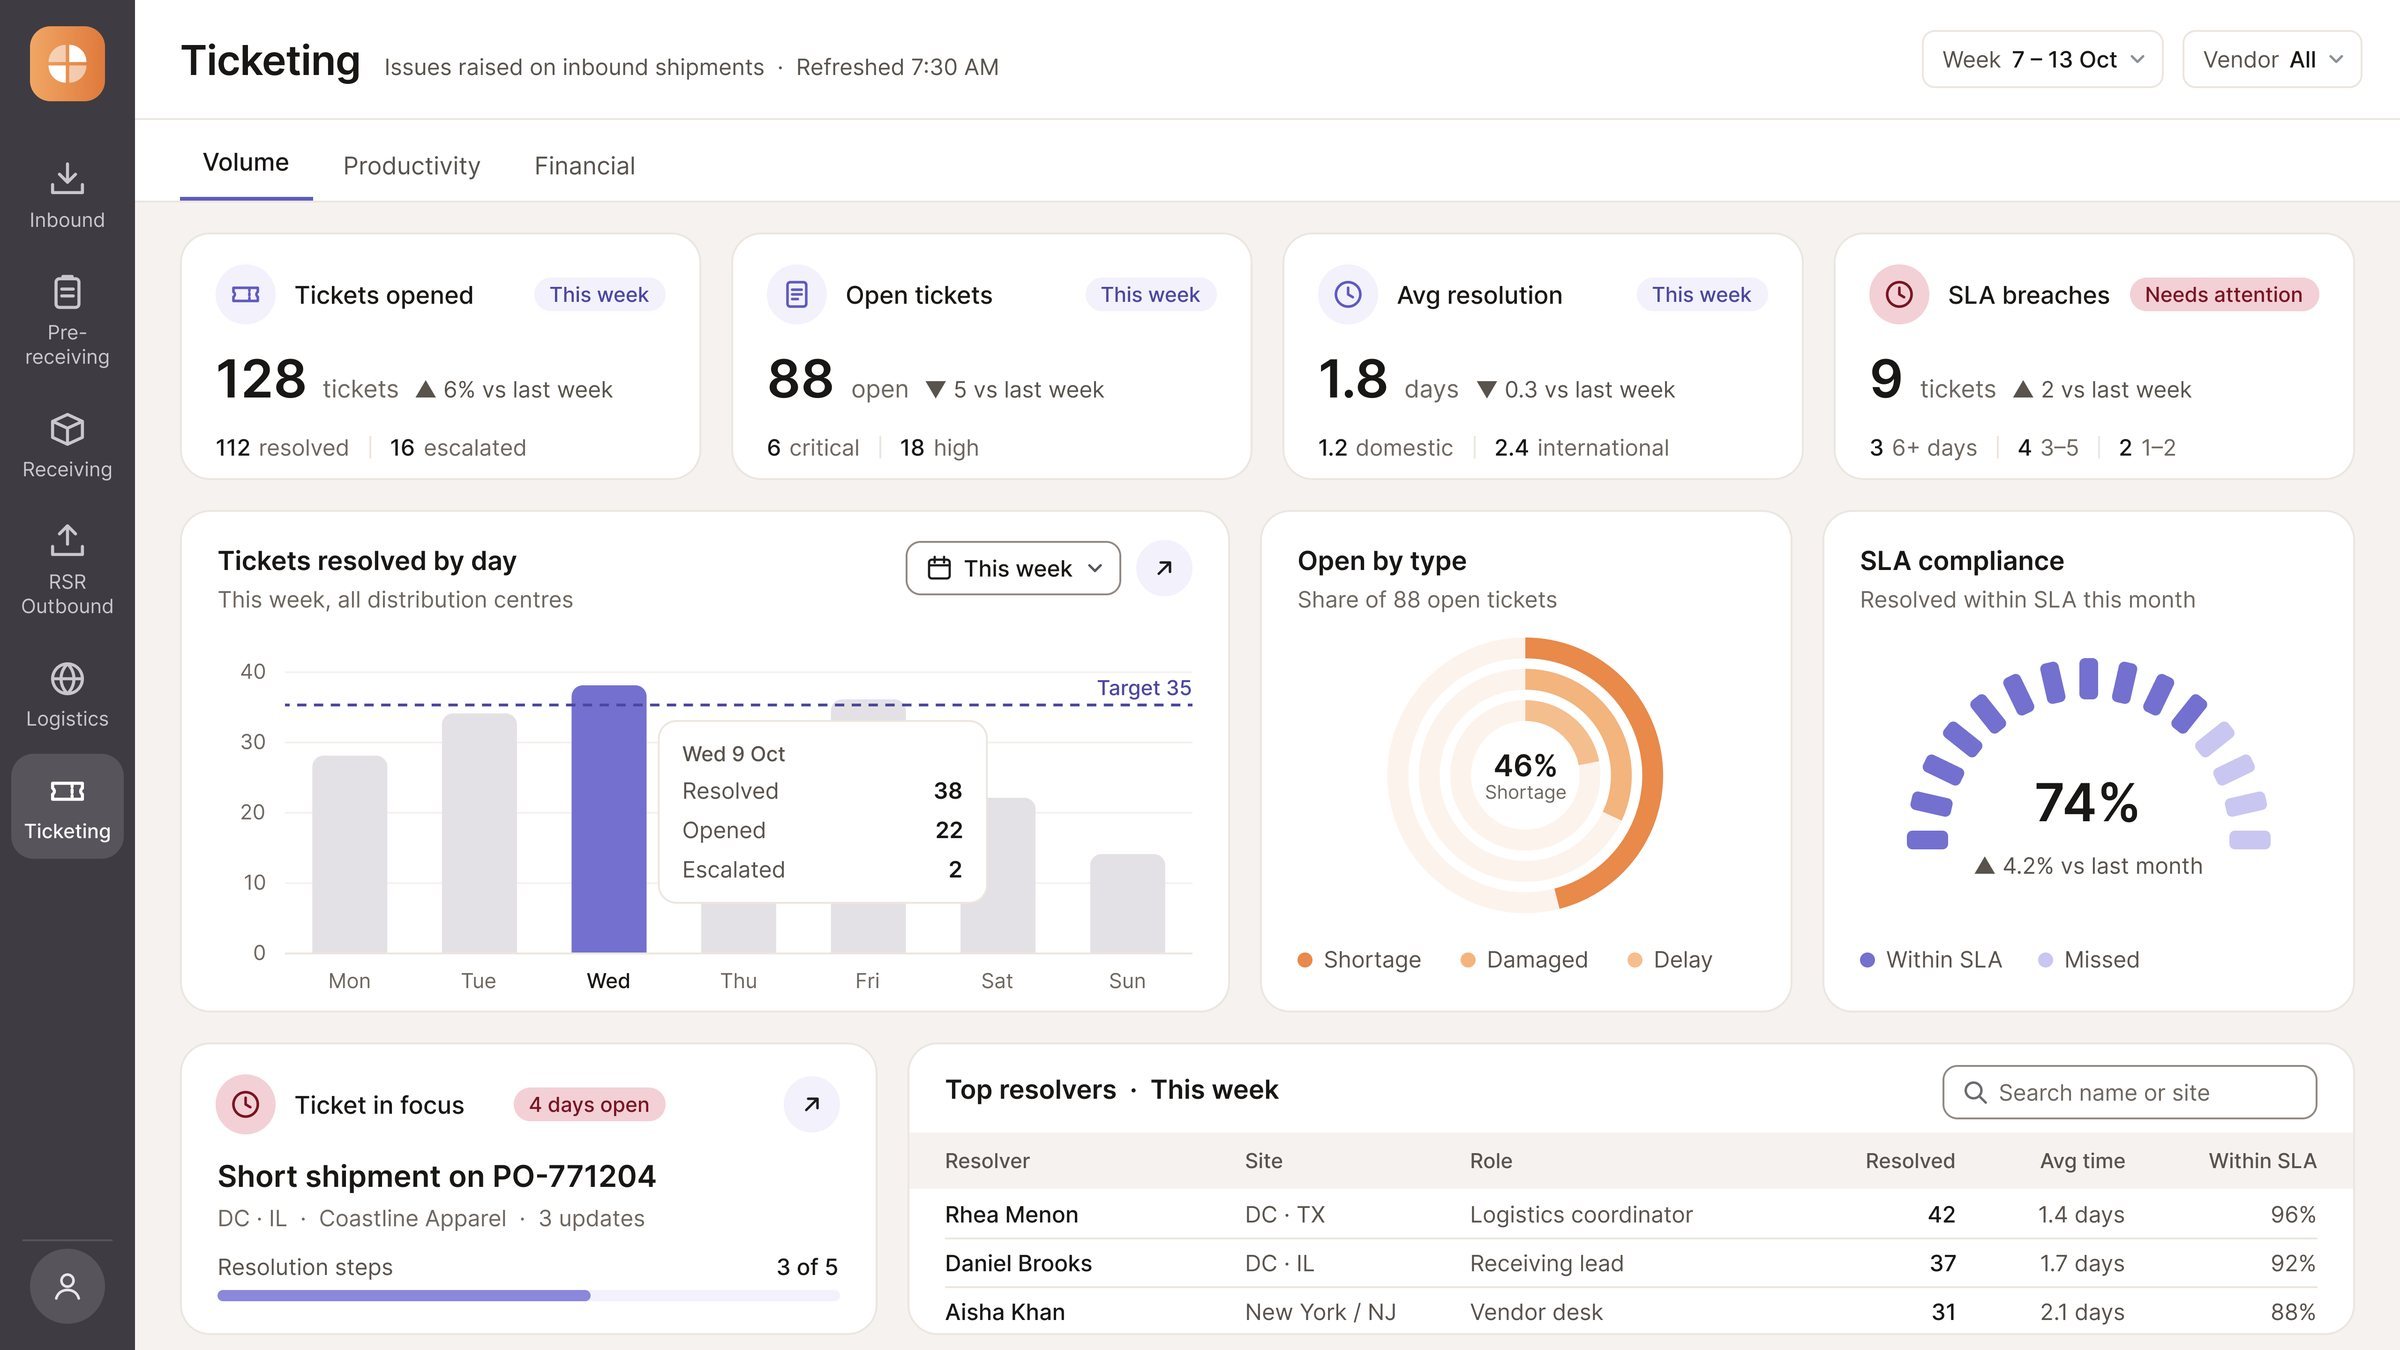
Summary cards lead straight to the detailed reports and spreadsheets behind them, so power users can dig into the data whenever they need to, without crowding the main view.
Ten months of sprints later, the logistics team has one place to see its whole operation, and the client chose to keep building with us.
Launched into production, replacing scattered spreadsheets with one dashboard suite
The client renewed the contract after the live dashboards delivered immediate value
Shipment delays surface faster, instead of being buried under secondary numbers
Three views on every dashboard: volume, productivity and financial
Next time I’d ask for at least one session with the frontline team. Taking every need secondhand through advisers cost a lot of time debating what users wanted, and hearing it from them directly would have settled those questions sooner.
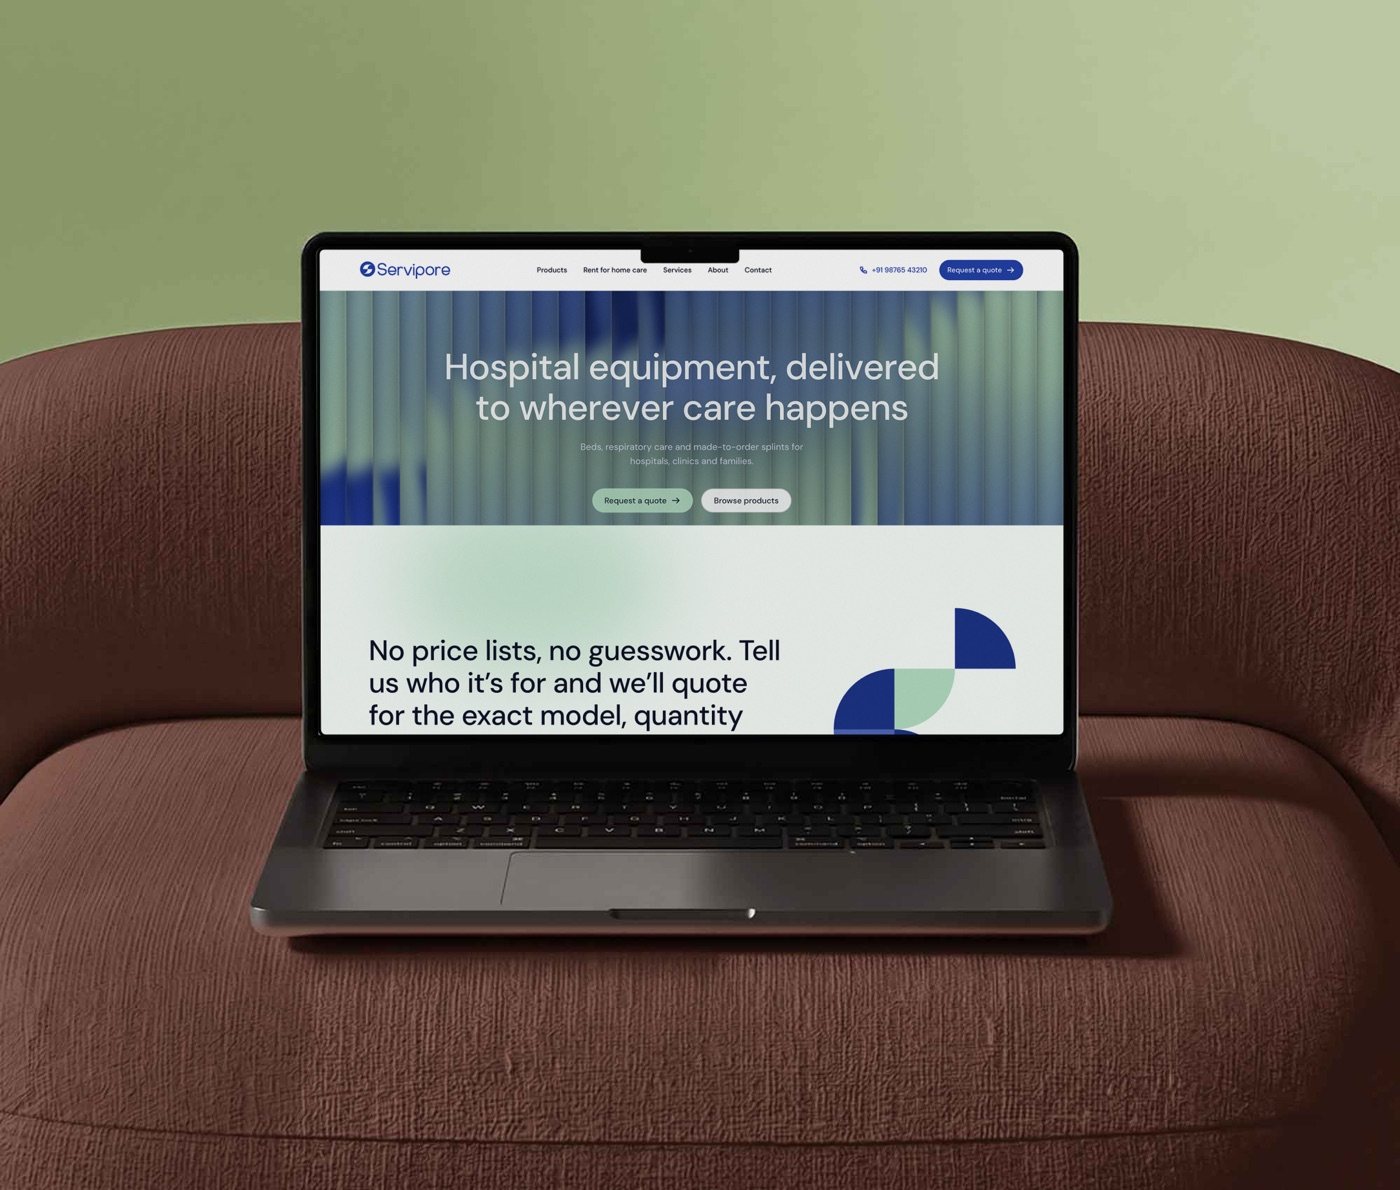
An identity and website for a medical equipment company selling to hospitals and homes.